One problem with traditional data maturity models is that they tend to use a common framework for all organisations, irrespective of market sector, current use of data and underlying data management challenges. A scale from 1-5 or a classification from ‘explorer’ to ‘innovator’ could be accused of being an over-simplification of issues which are often complex and always specific to each organisation.
A better approach might be to follow a series of practical steps that enable you to create a data maturity journey, specifically for your social housing business. A journey designed around the nuances of the housing sector, which will encourage the whole organisation to participate, and will provide a framework for measuring the resulting operational improvements as they are delivered.
Step one: Know your data
Sometimes it’s ‘data discovery’, sometimes it’s ‘data archaeology’, and sometimes housing providers already have a well-documented data landscape within well-managed core applications. However, in many large housing providers, their systems have evolved over decades, and often mergers have resulted in the duplication of systems and processes. These circumstances can be a recipe for poorly documented data assets which might be incomplete and/or fragmented across multiple systems. Further complexity is added by the proliferation of Excel spreadsheets, which either carry out bespoke departmental tasks and processes or store data that didn’t quite fit into the application landscape at the time. All of that is before we even consider the unstructured data that exists within PDF documents or other file types within shared folders across the organisation.
With the right tools and the right expertise, it’s possible to create an accurate map of the data landscape far faster than you might imagine. Metadata can be harvested from systems by data-profiling tools. Shared folders and PDF documents can be analysed and have their unstructured data turned into catalogued structured data.
Assuming the activity is carried out correctly, the data landscape should be consumable to all employees, not just a few individuals within the IT department.
If data is the fuel that runs every process in your organisation, everyone should understand their role in maintaining the quality and availability of that fuel.
Step two: Measure the quality of your data
It’s relatively easy to measure gaps in data and report very basic data-quality metrics. However, it’s a much more involved and complex exercise to create a comprehensive data-quality framework that measures more complex data-quality rules and then presents the findings via an easily consumable interface.
The Data Management Association (DAMA) identifies six dimensions of data quality; accuracy, completeness, consistency, timeliness, validity and uniqueness. By measuring these dimensions of data quality, it’s possible to create a comprehensive data-quality framework that doesn’t simply measure the obvious and easy things; it measures the overall quality of the fuel that runs your organisation.
The sheer size and scale of creating this measurement framework across all data assets is too great a task for most internal data teams. After all, most people prefer to buy or rent a house rather than build their own. Many data-quality tools are available on the market with a range of features and benefits, and some even contain existing data-quality rules’ libraries for specific market sectors, including social housing, to radically reduce the time and effort needed to create a data-quality framework.
Step three: Link your data strategy to your organisational strategy
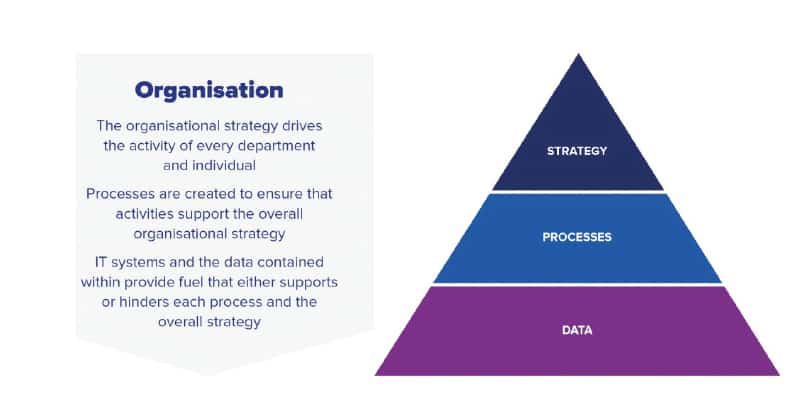
Measuring the quality of your data assets will help you to understand which areas of data are the lowest quality and which are the highest, but that won’t tell you which data assets are most important and should therefore be prioritised for management and cleansing. Only by understanding how your data fuels your key processes and how these processes support your overall strategy can you begin to manage data based on its importance.
Software tools exist that allow you to create an organisation-wide process map showing the individual data items that are necessary to complete each process so that you can measure the effectiveness of your data as a fuel. You can calculate the efficiency of every process, and accurately measure and predict the number of times when the process will fail due to poor or missing data. You can even start to calculate the cost of poor data quality within key processes by connecting the volume of failures caused by poor data with the internal costs associated with rework, manual intervention and process failure.
Step four: Create metrics for buy-in and improvement
Each department, senior leader and employee should be driven by their personal objectives and the overall objectives of their team or department. By linking data-quality issues to the processes that individuals and teams carry out every day, you can generate an appreciation of how the effective capture and use of data will improve individual performance and the performance of the organisation as a whole.
Data is rather a dry subject for most people, so asking them to contribute to the ongoing maintenance and improvement of data can be difficult. However, the conversation is completely different if you can translate the language and measurement into something that individual stakeholders care about and/or have responsibility for.
For example, finance directors are interested in (among other things) improvements in their ability to collect money and reduce arrears, housing directors are interested in improving their ability to contact tenants and complete maintenance jobs correctly, and call-centre operatives are interested in tenant satisfaction.
Data is the common fuel for all these processes and also for just about every process you can think of in a social housing environment.
By treating data as a fuel and by prioritising its management based on its importance to your organisation and its strategy, you can create an achievable data-maturity journey tailored to your unique data circumstances, challenges and opportunities.
Dan Yarnold is a director of IntoZetta.


